New in Power Bi is above all a new visual personalization feature to allow your end-users to explore and personalize visuals all within the consumption view of a report! The changes introduced in Power Bi also apply to fast refresh scenarios. The mentioned functions will be very useful: change detection for page refresh and support for relative time filters in minutes and hours. In addition, several other functions have been made available, including rectangular lasso select across visuals, conditional formatting for totals and subtotals, Direct Query support for AI visuals: decomposition tree and key influencers, several updates to Q&A, and more! What is more, some functions have been updated.
An additional month to update

In light of the COVID-19 crisis, we have decided to give more flexibility by providing an additional month to move over to the modern filter experience before we automatically migrate all reports in Power BI Desktop and Power BI Service. So, if you have not upgraded any of your reports, you have one more month to update your reports so you can tweak or customize any of the filter pane formatting before your reports get auto-upgraded in May.
Discover the latest solutions and updates
Reporting
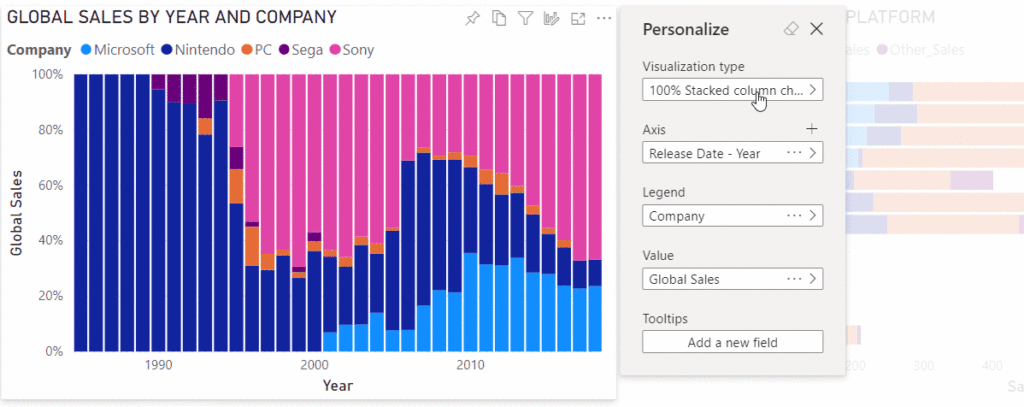
Personalize visuals
The introduced changes allow end users to view and personalize the visualizations in the report consumption view. Users can, among others:
- Change the visualization type
- Swap out a measure or dimension
- Add or remove a legend
- Compare two or more different measures
- Change aggregations, etc.

Change detection for page refresh
The page refresh will be based on detecting changes, not on specific refresh intervals. In this version we provide a new option Change detection. It allows you to specify how we should check changes in your source of direct queries, in particular which measure we should evaluate and how often we should check changes in this regard.
Relative time filter
With emerging fast refresh scenarios, the need to filter to a smaller window of time becomes more and more requested. So, this month, we’re very excited to announce a new type of filter: relative time filter. When the filter is applied to the page/report level, all visuals under that level are synchronized to the same time range.
Rectangular lasso select across visuals
Lasso makes it easy to select and select visual elements. Power BI allows selection by clicking and dragging on the work area. Thanks to this, all visual elements completely enclosed in the lasso will be selected.
Conditional formatting for totals and subtotals in table and matrix
The solution allows applying conditional formatting rules to subtotals and subtotals in table and matrix visuals. This function will work to set the background color, font color, icons and URL.
Customize theme dialog is now generally available
If you customize a theme in the theme dialog, an icon will represent that custom theme in a separate section in the theme dialog. This icon will update whenever you customize your theme. If you hover over the icon, a tooltip will show up that explains that the theme is a custom theme. You can also upgrade your base theme right in the report themes dialog to activate these text styling options.
Improved discoverability for conditional formatting
After making the changes, to access the dialog box, just click the fx button to the right of the object you would like to format.
Analytics
Direct Query support for AI visuals
- Decomposition tree
- Key influencers
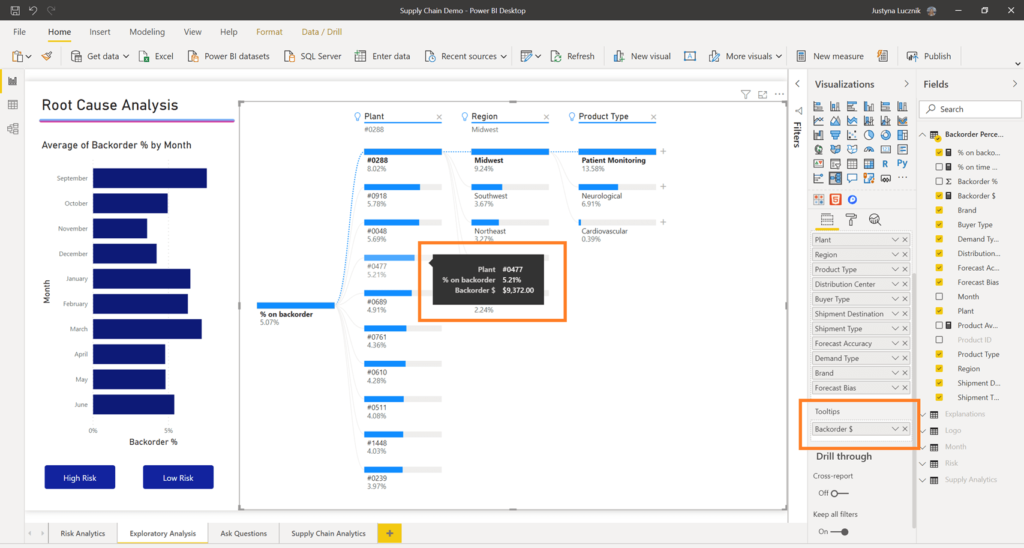
Decomposition tree now supports tooltips
A simple but useful update to the decomposition tree is that it now supports tooltips. You can add additional measures to the Tooltips option in the field well and have them appear when users hover on the data bars in the tree.

Q&A updates
Suggest questions
Now you can define your own questions to show up in the Q&A visual. In the new Suggest questions section in Q&A setup, you can create a list of questions to be shown in the Q&A visual. The questions will show up in Q&A in the same order as they have been created in.
Teach Q&A now supports measure conditions
Using the Teach Q&A option, you can add definitions to streamline the work of questions and answers with the data model. In the first version of Teach Q&A you could only create definitions in columns. Support for measurement conditions has been added this month.
Q&A is now supported on Power BI datasets
You can now use Q&A when connected to a Power BI dataset. When you are working on a PBIX file connected to a Power BI dataset, you can use add a Q&A visual to the canvas and ask questions.
Visualizations
Radar/Polar chart by xViz
It is an ideal for visualizing multivariate data similar to parallel coordinates chart. Radar charts are suited for showing outliers and commonality by comparing one or more categories across different variables. For example, comparing product performance across various metrics like the ease of use, aesthetics, and durability.
Comicgen by Gramener
Comicgen by Gramener adds comic characters whose emotion, pose, and angle can be controlled by data. Users can show two or less KPI’s at a time. Each KPI can be visualized as emotion and pose. You can choose to keep the visual emotion or pose or both static to your choice by selecting appropriate emotion and pose from the visual settings. Users can choose different comics.
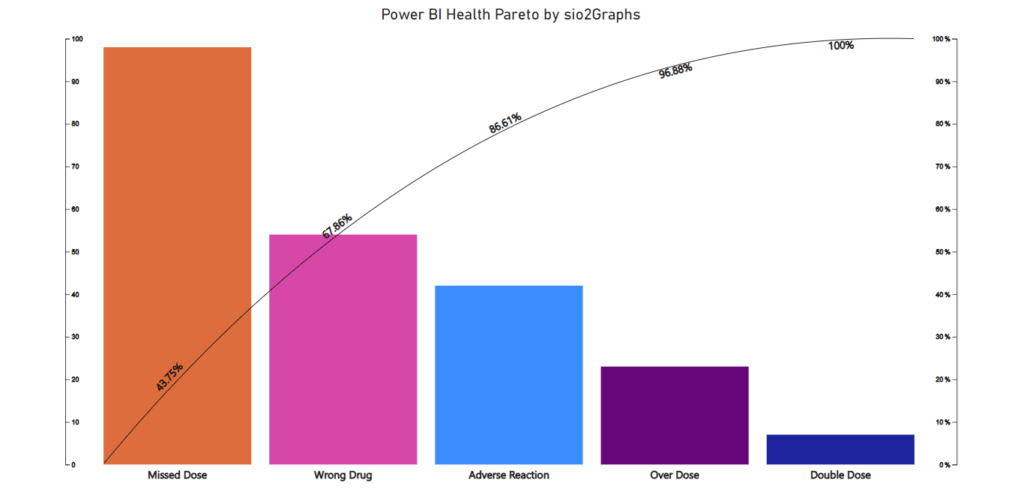
Pareto by sio2Graphs
Pareto charts are used to visualize the results or outcomes for any process in order to identify the specific factors driving or impeding an effective conclusion.

Growth Rate Combo Chart by Djeeni
The Growth Rate Combo Chart by Djeeni is a powerful visual that displays the percentage difference between the consecutive category values, with the base for comparison being the category on the left. In enables showing percentage change between two or more categories or change between periods.
Smart Filter Pro by OKViz
Smart Filter Pro by OKViz is the premium version of Smart Filter. It provides a compact slicer that applies filters in many different ways, including autocomplete and incremental search in a dropdown list.
New Visualization icons
Template Apps
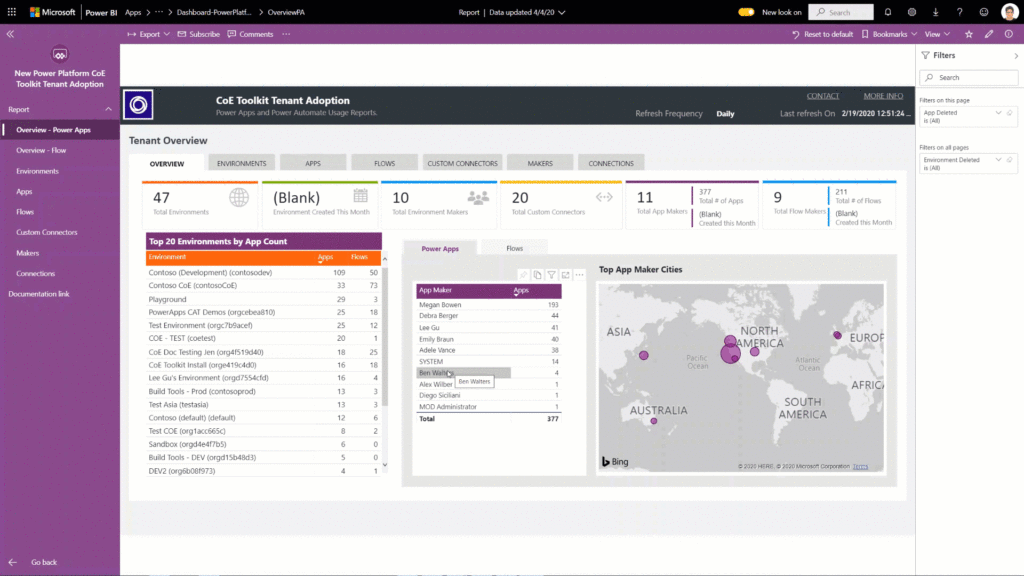
Power Platform Center of Excellence (CoE) StartKit
The tool provides a holistic view of the resource usage in your tenant, including environments, Power Apps apps, Power Automate flows, connectors, connection references, makers and audit logs.

Azure Cognitive Search: analyze logs and metrics
Azure Cognitive Search is a cloud search service with built-in AI capabilities that enrich all types of information to easily identify and explore relevant content at scale. Azure Cognitive Search allows you to store operation logs and service metrics from your search service into an Azure Storage account. This Power BI template app specifically enables you to analyze those operation logs and metrics so that you can obtain better insights about your search service. The Power BI app provides detailed metrics about queries, indexing requests, operations, and more
COVID-19 Apps
We’re living in unprecedented times as the world faces the COVID-19 pandemic. As healthcare providers and local governments work to slow the spread of the virus and ultimately save lives, it’s critical that these organizations are equipped with accurate information in a timely manner. To help these organizations and individuals stay informed, several of our Power BI partners created template apps track of COVID-19 pandemic.
Data preparation
Enhancements to Query Diagnostics
Newly run query diagnostics options allow you to configure diagnostics and performance results for queries. A new one has also appeared in the functionality to configure query diagnostics.
Data connectivity
CDM Folder view for Azure Data Lake Storage Gen2
Into the beta version was implemented the CDM Folder view for the Azure Data Lake Storage Gen2 connector. This will allow you to select if you want to view content in your data lake as CDM entities.


